Prometheus
Observability prototype: a React dashboard wired to an Express service. The server exports Prometheus metrics, and AJV validates every response payload at runtime.
Metrics + schema validation, full-stack
- TypeScript
- React
- Node.js
- Express
- Prometheus
- AJV
Why I built this
A lot of full-stack demos skip over the contract between client and server. The client trusts whatever the API sends back, the API trusts what it does, and when something breaks in production you usually find out hours later through Sentry.
I wanted to build a small thing that took the contract seriously. Every response gets validated against a schema before it leaves the server, and the server emits Prometheus metrics so the dashboard can show its own state next to whatever else it’s fetching.
What it does
- React + Tailwind + MUI dashboard fetches the current server time (in epoch seconds) from an authenticated endpoint.
- Express server validates every response against an AJV schema before sending. The validation is on the server boundary, not in the client.
/metricsexposes Prometheus counters and histograms for request count, error rate, and latency.- Tests cover both schema validation and the metrics output.
- Live demo: peppy-puffpuff-62981e.netlify.app.
Architecture
Two things in this diagram are worth knowing. AJV runs inside the
response path, not just in tests, so if a response shape drifts the
server refuses to send it. And the metrics come from the same
process that serves the API. There’s no agent or sidecar.
prom-client instruments the handlers in process and Prometheus
scrapes the endpoint.
Technical decisions
AJV instead of writing a validator by hand. You can reuse the
schemas on the client too if you want to validate incoming data
the same way. Compiled validators are also faster than chains of
if-statements.
Prometheus format on the server itself. Pushing metrics to a SaaS works but you lose the option to keep alerts close to the deploy. The exposition format is a one-line dependency.
Tailwind plus MUI. Tailwind for layout, MUI for ready-made widgets. Picking one of them would have meant rebuilding the other.
No state framework on the client. No Redux, no React Query. It’s a dashboard. A fetch hook is enough.
import Ajv from "ajv";

const ajv = new Ajv({ removeAdditional: "all" });

const TimeResponse = ajv.compile({
  type: "object",
  properties: {
    epochSeconds: { type: "integer", minimum: 0 },
  },
  required: ["epochSeconds"],
  additionalProperties: false,
});

app.get("/api/time", (_req, res) => {
  const body = { epochSeconds: Math.floor(Date.now() / 1000) };
  if (!TimeResponse(body)) {
    return res.status(500).json({ error: "schema violation" });
  }
  res.json(body);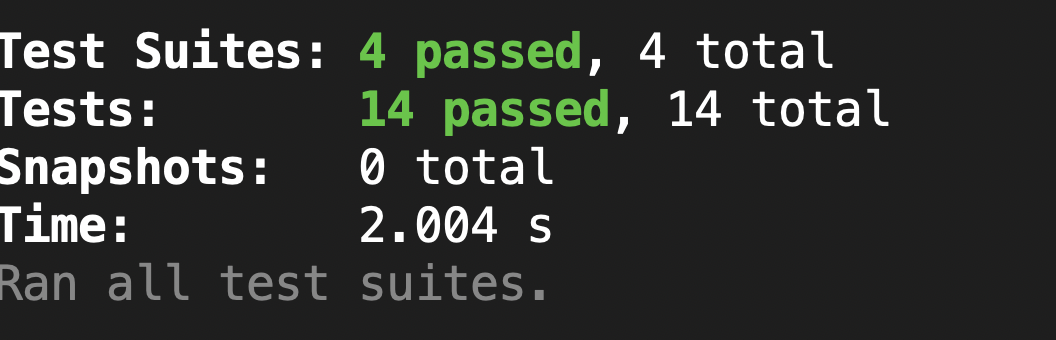
});Tests as a contract
Every endpoint has a paired schema test. The runtime validation catches drift in production. The tests catch it before it ships.
What I learned
The first time someone refactored a response field, the server
refused to send it and the line number was right there in the
logs. That was much faster than chasing an undefined in the
browser.
The Prometheus format is simpler than I thought. A few Counter
and Histogram instances and you have a useful dashboard.
Full-stack projects feel real once at least one thing crosses the whole stack. Observability is a good fit because it makes you think about the contract.
Next steps
- Hook the Prometheus endpoint up to a hosted Grafana so the live demo actually shows metrics, not just a clock.
- Add a second endpoint with more complex payloads so you can see schema validation catching real drift.
- Try rebuilding the server with Hono on Bun and compare the latency histogram.
- Pull the chart components, metric tiles, and the schema-aware fetch hook into a small reusable kit.
Source: github.com/uzairali19/prometheus.